The SEG Plaza, in the centre of the southern Chinese city of Shenzhen, rises to nearly 300 metres in height. This skyscraper is the workplace for thousands of people. On May 18th, 2021, these occupants suddenly felt the building begin to sway. Understandably terrified, they fled outside.
On YouTube you can view the disturbing phenomenon unfolding. According to a report from the state-backed China Securities Journal, it was all down to an aerodynamic phenomenon known as a Kármán vortex street – a result of high winds, temperature differentials, and the subway train line running beneath the building.
Accounting for the effect of the wind is a key and well-understood aspect of tall building design. Thanks to new research from Cornell University, in the United States, wind effects should soon be understood even more. Researchers at the New York State-based university have compiled a new global extreme wind atlas, described as “a digital compendium filled with documented extreme wind speeds for all parts of the world”.
While the atlas will be useful for civil engineers working on tall buildings and bridges, its chief target is the wind energy industry. Wind is a growing contributor to our energy supply: China leads the way in wind energy capacity (36 per cent), ahead of Europe (31 per cent) and the USA (17 per cent). According to the Global Wind Energy Council, an industry trade body, a record 93GW of new capacity was installed globally in 2020 – a 53 per cent year-on-year increase. The council calculated that total global wind power capacity is now up to 743GW, removing more than 1.1 billion tonnes of carbon dioxide from the atmosphere every year.
The 93GW installed in 2020 remains well short of the amount needed to avoid the worst impacts of climate change, however. One of the impediments to progress is that the capital investment for wind energy projects is significant. These costs are increased by uncertainties in the modelling of wind speed. If engineers can’t be sure about the wind speed a turbine might face, how can they know what type of turbine to install? According to Sara Pryor, professor of Earth and atmospheric sciences at Cornell University and one of the lead researchers, this can even result in over-engineered turbines, designed to deal with wind speeds they would never experience.
Removing this uncertainty and increasing the accuracy of data allows energy companies to reduce the financing risks. That’s where the wind atlas comes in. Until now, the precise data has been unavailable and developers have been forced to estimate.
“Our digital atlas is of extreme wind speeds, so it will provide guidance on what class of wind turbine might be most appropriate in a given location,” Pryor told Chart magazine. “Wind turbines are not bespoke but are built within certain classes, according to how harsh the environment is in which they are going to be deployed.”
The atlas, which is available for public download, draws upon 40 years of hourly output taken from the European Centre for Medium-Range Weather Forecasts, based in the British city of Reading. The result is a world map segmented into a million cells, each with its own extreme wind speed estimate.
“Making better estimates of these extreme wind speeds should help developers to make cost-efficient decisions and continue the historical declines in the cost of electricity from this important renewable source,” Pryor adds.
It might also, to a certain degree, reassure the nervous employees in Shenzhen’s SEG Plaza.

SEG Plaza
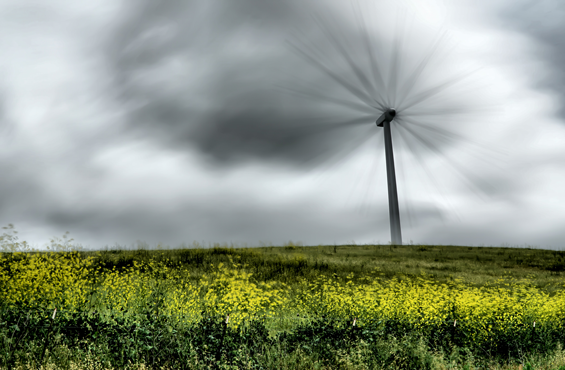
Image credit: Casey Horner (Unsplash)
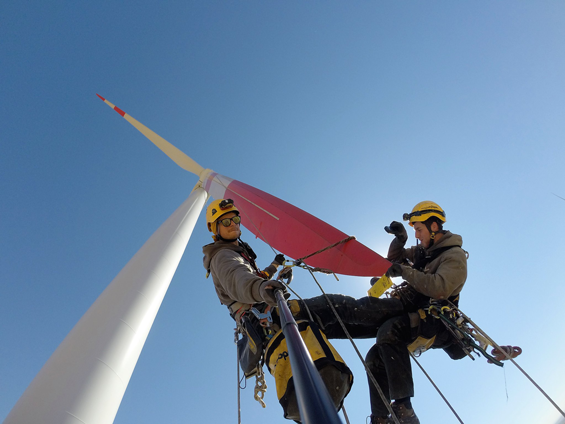
Image Credit: Global Wind Energy Council

Image Credit: Global Wind Energy Council
Banner image credit: Global Wind Energy Council
Written by:
Author